¶ dashboards
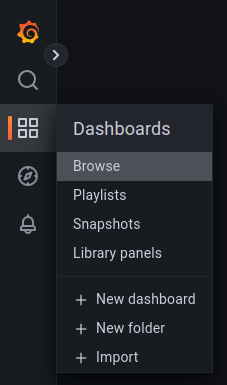
To go to the list of dashboards on the main toolbar Grafana, select Dashboards, from the drop-down menu, select Browse:

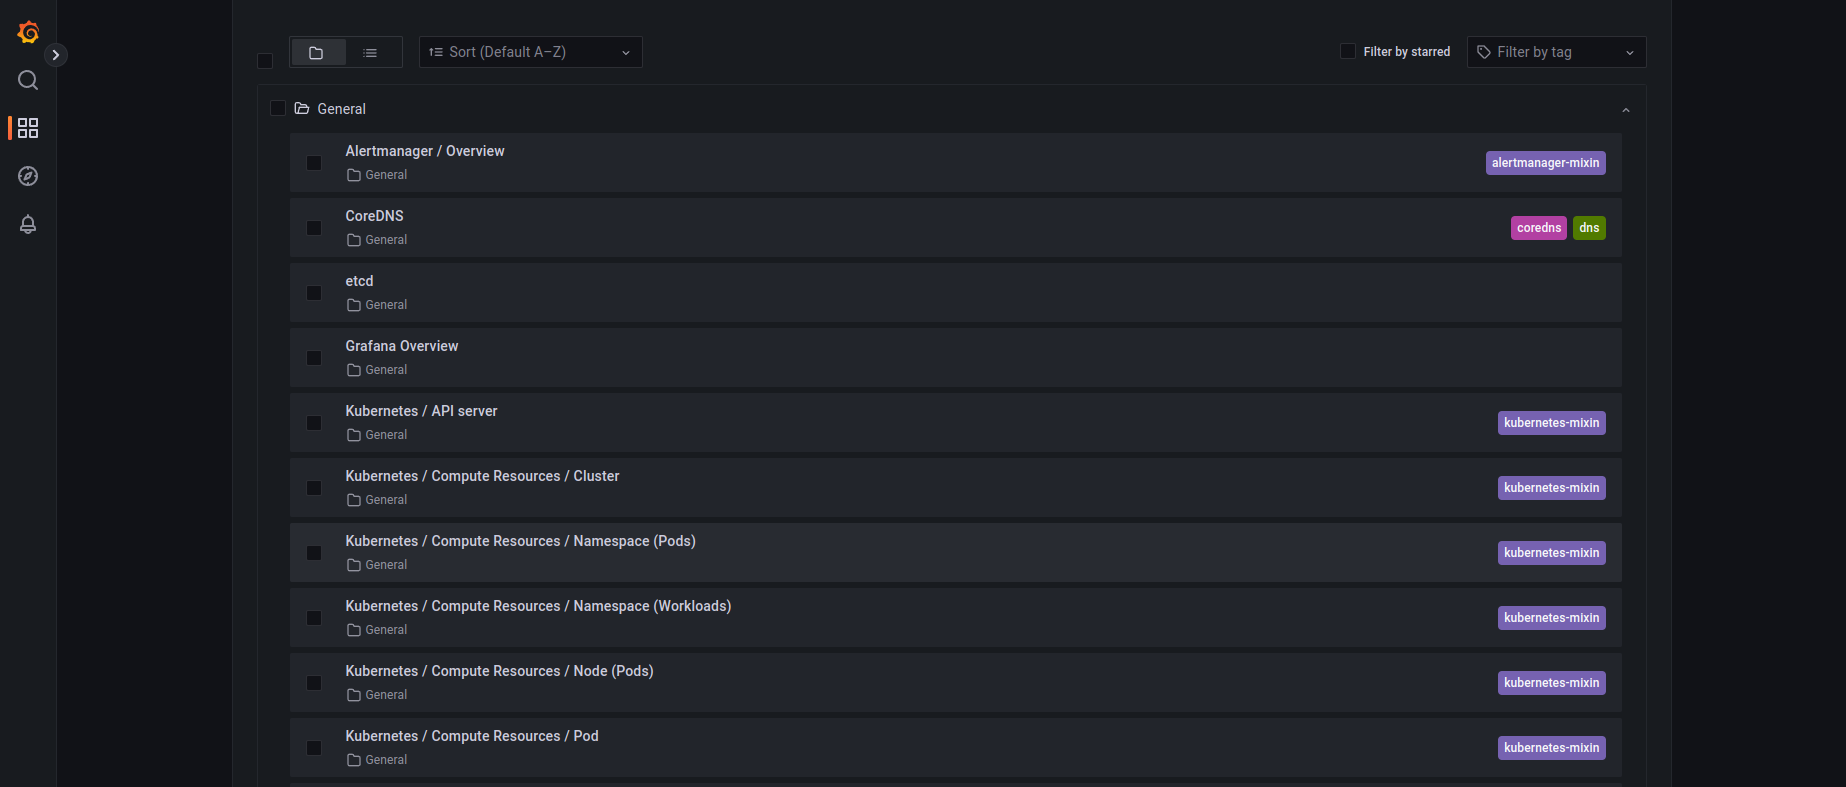
In the list that opens, select the dashboard of interest to you:

¶ Kubernetes state visualization
extremum uses a standard package of dashboards from the composition kube-prometheus-stack