¶ Magazines
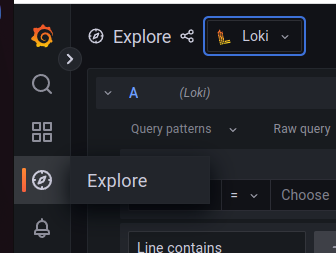
On the main toolbar of Grafana, select Explore; in the Explore drop-down list at the top of the page, select Loki
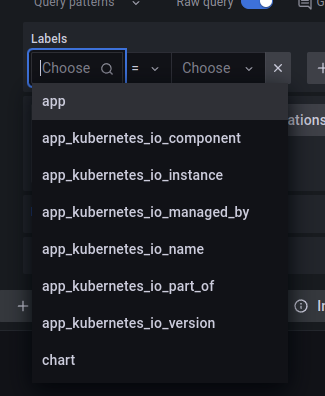
To view the log of a specific platform component in the Labels drop-down list, select app:
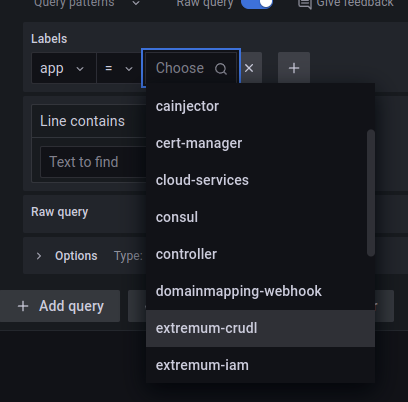
Then select the service you are interested in from the drop-down list to the right of the comparison operation:
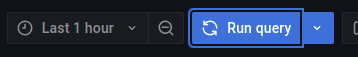
Use the widget in the upper right corner of the screen to specify the time range and click the Run query button:
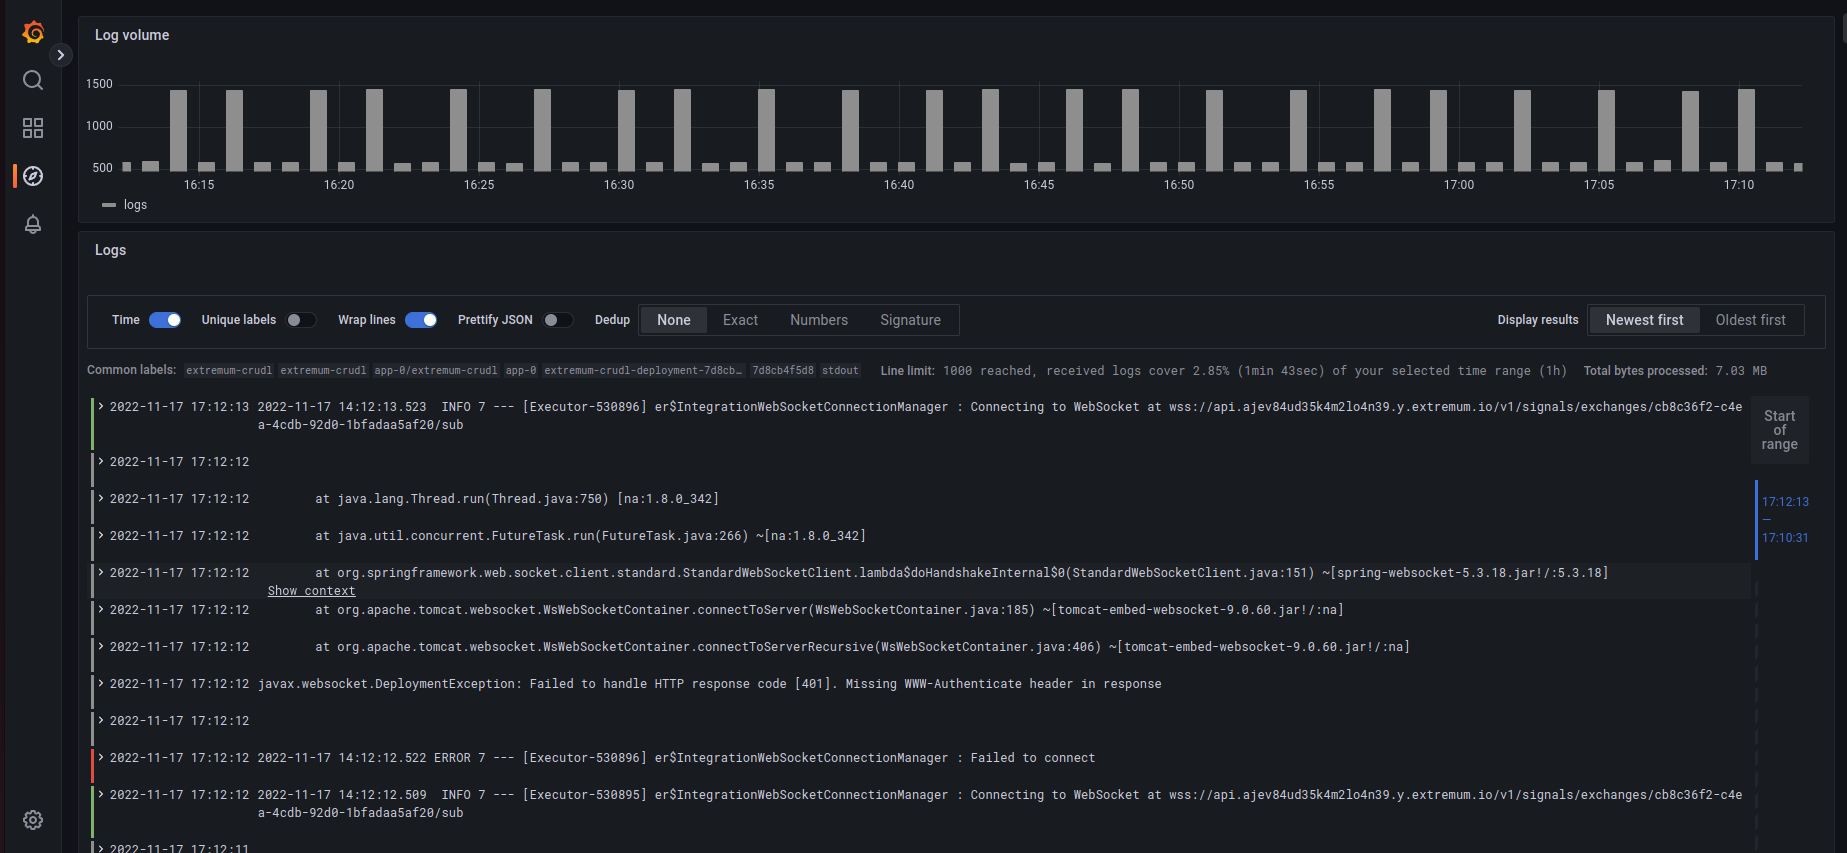
A list of log entries will be displayed at the bottom of the page:
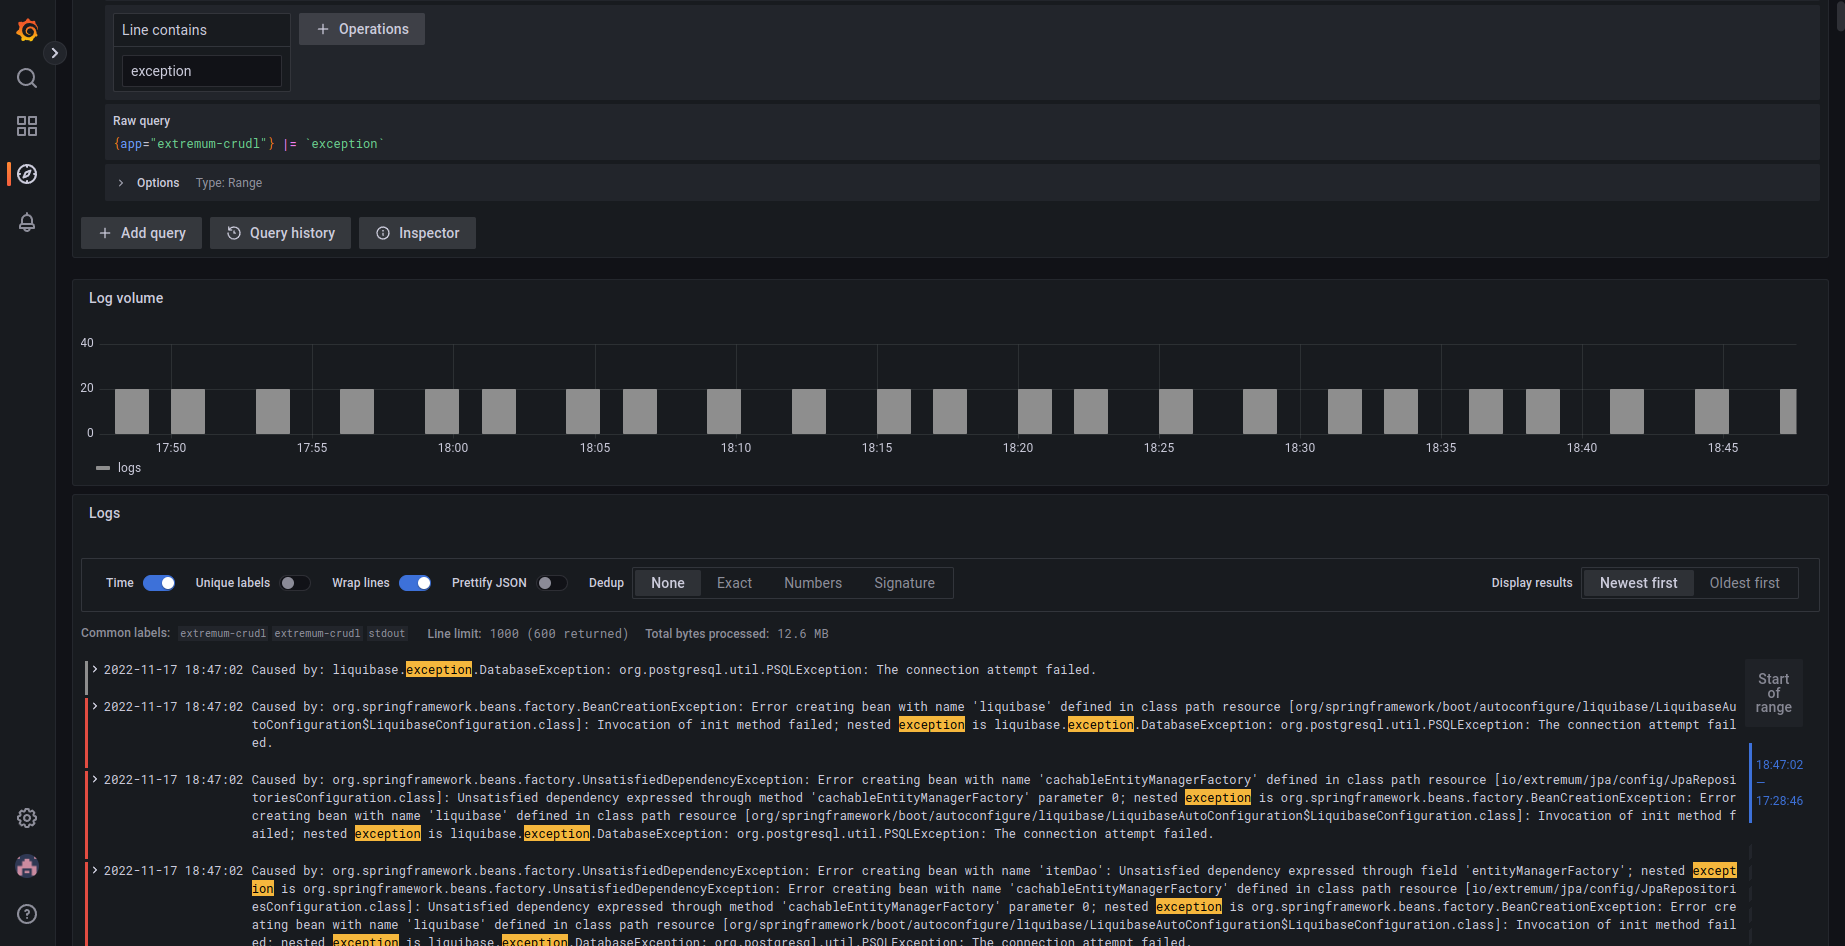
You can also search for log entries by substring or regular expression:
Grafana has a well-developed query language that provides extensive filtering, aggregation and formatting of data. You can read about it in the [official documentation]